Healthy Schools as a Learning Tool
Does Temperature Impact Student Performance? Learn what these EPA Special Achievement Award winners found out
Room temperature and its impact on student test scores
By Josean Perez, Julio Montano and Jose Perez
Westview High School, Portland, Oregon
At this year’s Environmental Protection Agency (EPA) symposium held in Washington, D.C., three members of the Science Research Club from Westview High School Beaverton, Oregon, were honored with a Special Achievement Award.
Tenth grade student Josean Perez, junior Julio Montano and senior Jose Perez from Westview High School decided to tackle the question of whether room temperature affects student performance.
Their teachers and club advisors Debbie Cooper and Mark Geren supervised the study. The team conducted several aptitude tests on 9th graders in classrooms with varying temperatures to determine how well they performed. This is how they conducted the test and what they found.
The basis of the study:
 The award winning team pictured at the EPA Indoor Air Quality Symposium. |
When students take classes, teachers want to know what they learned. And, perhaps the most common way of measuring knowledge is by testing their skills. However, research has shown that several factors other than knowledge have an impact on student performance. These include noise around students taking tests, language capability, student’s mood, whether the student took rest before the test etc.
This study originated when students at Westview complained about temperature control in the building. This experiment demonstrates whether classroom temperature has an impact on student performance.
The researchers wanted to find out at what room temperature ninth graders demonstrated the longest attention span. They hypothesized that students will pay more attention when the room temperature is neutral, not too warm or cool.
Initial test doesn’t prove correlation:
An initial test was administered to ninth graders in six different classes. The test included how they would memorize shapes, recreate them, name basic shapes, colors, and solve basic math equations.
To control variability from class to class:
- The groups tested were the same age, so they would have the same opportunity to take the test.
- Six different classes were tested, so students didn't have any prior knowledge about the content of the test.
- Teachers offered an incentive, so they would do their best in the test.
- The groups and the time of the day were picked randomly.
- All the rooms used were science rooms, which are prior to testing similar.
- The group stayed in the classroom at least 10 minutes, so the student’s would have time to acclimate to the room’s temperature.
The room was made hotter by heating the room by placing hot plates around the room. To cool the room, the windows were opened and ice was placed in the sinks. The results of the first test showed that test scores between the different rooms kept at different temperatures were not significant.
Based on feedback from judges at the Beaverton Hillsboro Science Expo, researchers identified several issues with their initial procedure. One major issue was that the first test was not a direct measurement of attention as it was too simple.
In an effort to correct this, the researchers administered a complex, symbol-based test in Phase Two. Prior to using this test it was “pre-tested” by members of the research team and determined to be more difficult.
A second issue was that the change in temperature was not significant enough to see a marked difference on the scores. However they could not change the room temperature more than about 1oC in Phase One. In Phase II, the temperature could be changed significantly in four classrooms by utilizing portable classrooms as the test sites. Each has its own HVAC system and the classroom temperatures could be varied by 10 degrees Fahrenheit from room to room.
A third issue that came up was to streamline the method to control variables and this was achieved by making the instructions more specific.
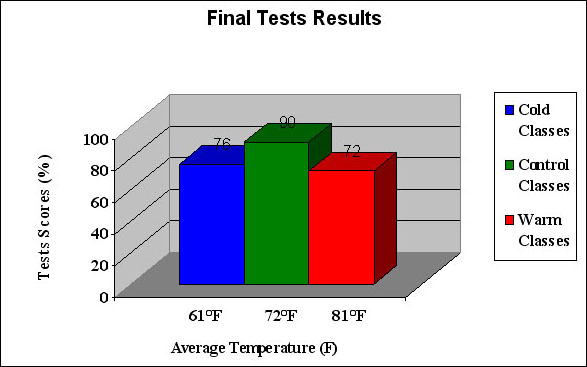
Data collected after administering the test in Phase II revealed that temperature clearly affects the attention span of students. The average test scores for students in different classes were similar in the same category (cold 78% and 74%); (too warm 72% and 73%); (control 87%, 92% and 93%).
The probable sources of error included that:
- The tests were given in different rooms, that had different posters which might have affected student’s attention span
- The rooms had different amounts of sunlight, which could affect their attention span. For example, by making them sleepy.
- Different times of day, because some students might be thinking of after school activities or not fully awake.
- Different test givers, because of the way they expressed the directions, even though all test givers followed a written procedure.
- Different amounts of talking on the tests, some classes were louder than others, which could affect the attention span.
Thus, the data collected in the second round of testing was more conclusive than the earlier experiment proving that temperature does have an effect on student attention span. However this data is not strong enough to conclude exactly the amount of effect that temperature variation has on attention span.
Second graph:
This graph shows a more pronounced effect on attention, because the changes in temperature were more drastic than in our first attempt.
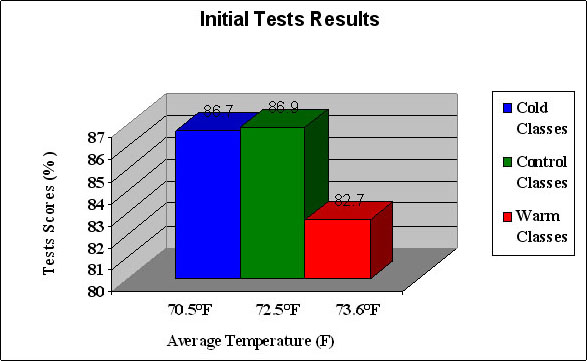
This graph shows our initial data our group collected. As you may see, the temperature affects attention, but the changes in the scores were minimal as were the changes in temperature.
This table shows a more pronounced effect on attention because of the temperature. Since the changes in temperature were more drastic than in our first try, the results were also more distinct.